Current State and Historical Data
Current State and Historical Data
Our campus is in a place of challenge. We have real and ongoing budget issues that require our immediate attention and sustained work. The signs of financial distress outlined by the National Association of College and University Budget Officers (NACUBO) mirror issues on our own campus.
- Declining or unstable enrollment relative to expense base
- Repeated use of reserves to cover structural deficits
- Deferred maintenance or capital reinvestment delays that hurt the institution’s ability to deliver a quality experience for students and a supportive environment for academics
- Diminishing auxiliary margins that keep the institution locked in the status quo or worse
- Unclear financial practices at college and division level creating an unclear financial picture
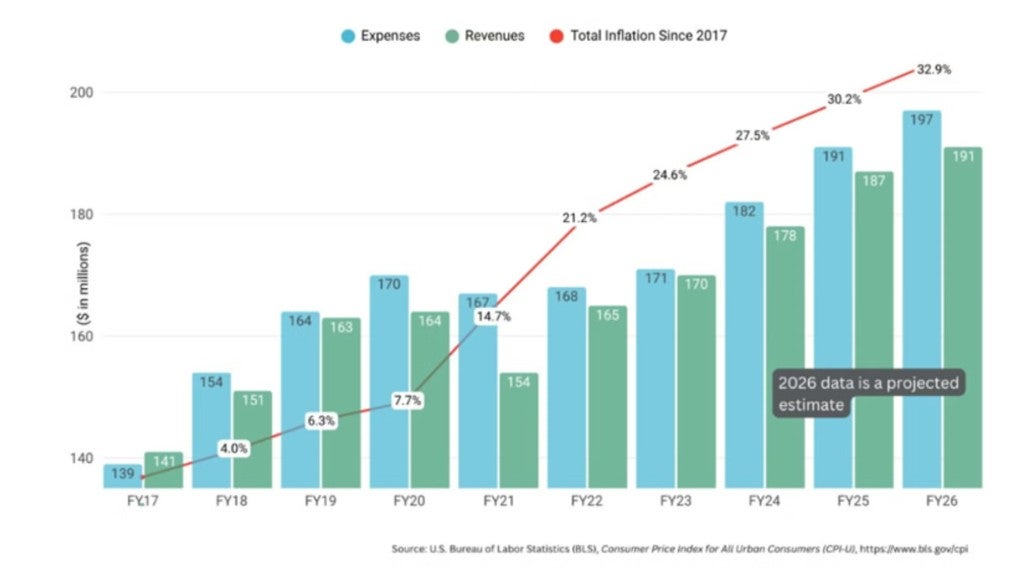
Specifically, our campus has experienced eight consecutive years of budget reductions and reallocations. Even with that work, we continue to experience revenue growth at only 2.62 percent which outpaces our expense growth at 3.34 percent.
We aren’t alone. Many institutions of higher education have experienced the same issues related to shrinking state support, growing competition, declining student enrollment, expanding expectations for enhanced student experiences and growing regulatory expenses.
Historic Context
Historical Context: Revenue growth is outpaced by expense growth from 2018 through the present. Inflation continues to rise and state support continues to decline.
Growth Campus
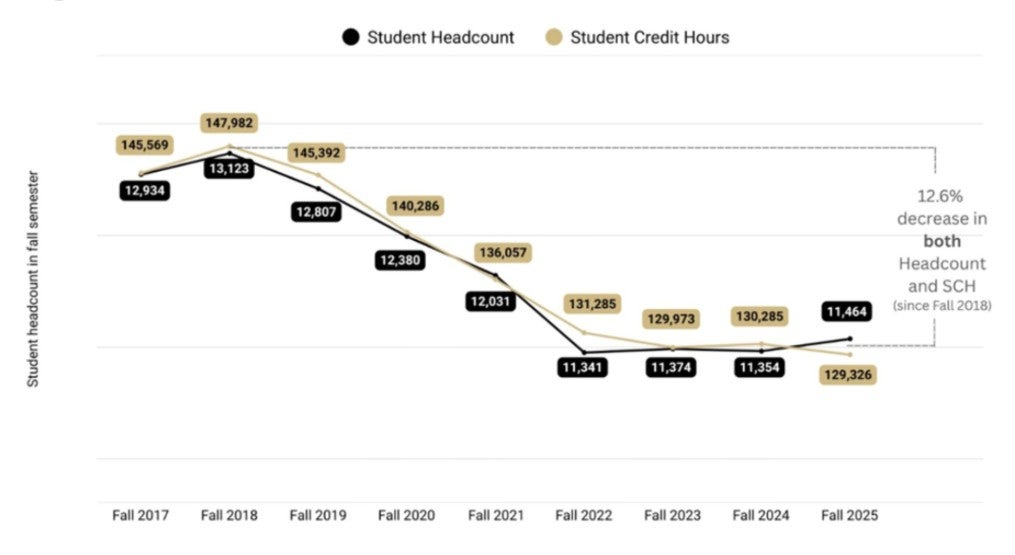
At UCCS, we add to these challenges, the assumptions we made that we would continue to be the “Growth Campus.” When enrollment started to decline after our peak in FY 2017-18 at 12,500, we continued to fund new positions with one-time funds because we continued to believe we would grow our way into funding them with ongoing funds. This was a natural reaction to our past but did not correspond with our present and what became our future.
Historical Context
Historical Context: Historic student headcount trends from 2017 to 2025 showing a more than 12 percent decrease in both student enrollment as well as student credit hours during that timeframe.